The Productivity Report helps you understand your daily work patterns, track your focus trends, and see how your productivity evolves over time.
You can access the Productivity Report from the Reports icon in the bottom navigation bar on the Home screen.
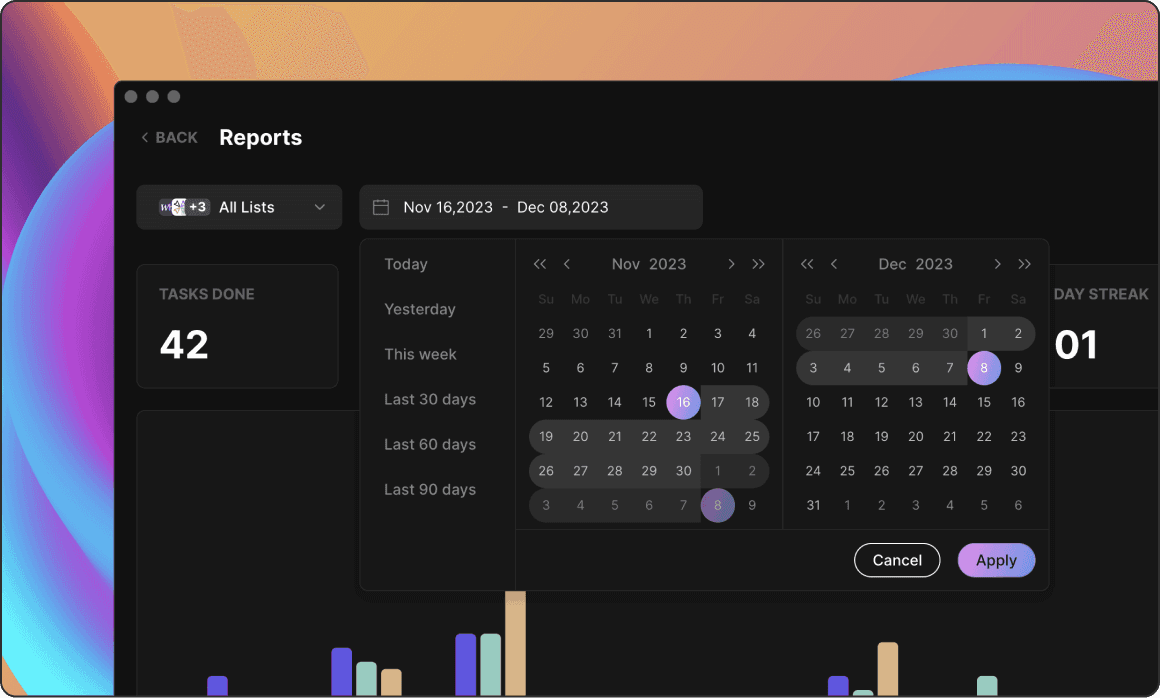
List & Date Filtering
At the top of the Reports page, you can:
Filter by List to focus on specific areas of work or select All Lists for a full overview
Choose a date range, using quick shortcuts or a custom selection
All insights and graphs below will adjust based on the filters you choose.
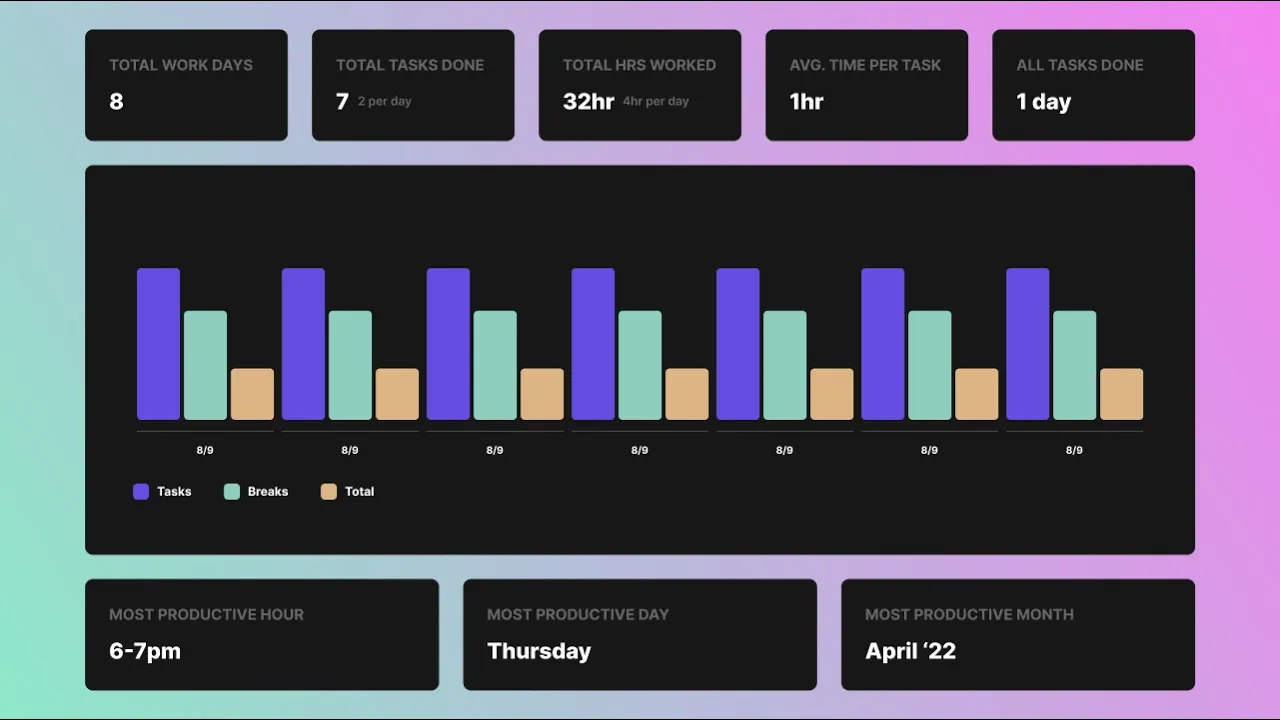
Daily Productivity Graph
This graph gives you a clear visual breakdown of your activity for each day in the selected period.
Purple: Hours spent on tasks
Green: Hours spent on breaks
Yellow: Total session time (tasks + breaks combined)
You can toggle each metric on or off to customize the graph.

The metrics above the graph provide a quick overview of your key activity patterns:
Total Work Days — Number of days you were active in Blitzit
Total Tasks Done — Total tasks completed, plus the average completed per active day
Total Hours Worked — Combined time spent on tasks and breaks, plus average hours per active day
Avg. Time per Task — Average time spent per task, including partially completed tasks
These stats update dynamically based on your List and date filters.
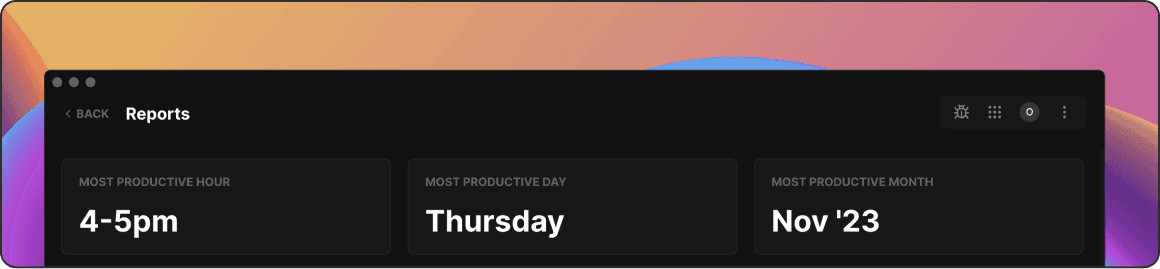
Most Productive Times
This section shows when you tend to work most effectively, based on your actual live sessions:
Most Productive Hour — The hour of the day when you focus the most
Most Productive Day — The weekday with the highest number of focus sessions
Most Productive Month — The month with the most active time (if your selected period spans multiple months)